Reading Between the Contours: A Resident’s Audit of Heathrow’s 2026 Noise Maps
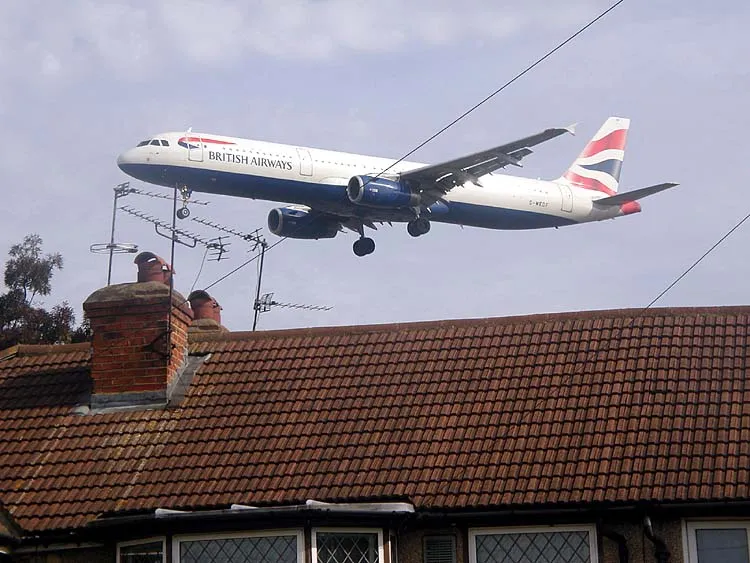
Photo: Unknown, Copyrighted free use, via Wikimedia Commons
Noise contour maps are not neutral pictures. They are arguments drawn to scale. When Heathrow or its consultants present the 2026 contours, residents in Cranford, Harmondsworth, Hillingdon, Hounslow, Slough and Windsor are entitled to read them critically rather than simply receive them.
The point is not to reject modelling outright. It is to insist that modelling be transparent, comparable and honest about what it leaves out. A contour line can look orderly on a consultation board while concealing more frequent awakenings, quieter gardens under flight paths and schools that never appear in the key.
These six questions are designed for consultation events, council scrutiny committees, resident associations and anyone preparing a written representation. They are minimum standards, not tricks.
1. Which noise metric is being used, and what does it smooth away?
Ask whether the map uses LAeq, Lden, Lnight or an event-based measure. Ask for the averaging period and the exact definition of each contour band. A annual average can make a place look stable while individual aircraft movements become more frequent or more concentrated.
For night noise, the key question is whether the map shows an eight-hour average or the number of events above a given threshold. Residents experience awakenings, not annual averages. Request both the average and the event counts, and ask how the map accounts for sleep disturbance rather than merely daytime annoyance.
2. What baseline and future scenario are being compared?
A contour is only meaningful in relation to a baseline. Ask whether the comparison year is 2019, 2023 or a later forecast, and ask why that year was chosen. Do not accept a comparison that flatters the proposal by selecting a weak baseline or by presenting percentage changes without absolute numbers.
Request the fleet mix, passenger forecast, runway configuration and terminal assumptions behind each scenario. If demand forecasts are uncertain, ask for sensitivity analysis showing what happens under lower growth. A map that assumes one future is a prediction, not a neutral fact.
3. How are night flights and respite periods treated?
Night noise is not a single average. Ask for the number of aircraft movements between 23:30 and 06:00, the distribution of those movements across the night, and the noisiest aircraft types within the fleet. Ask whether respite periods are guaranteed in the operating arrangements or merely modelled as an aspiration.
Ask how the map reflects the World Health Organization’s evidence on sleep disturbance and cardiovascular effects. If the answer is that night flights are within a quota, ask what the quota means in practice for a household under the final approach path. Quotas can be met while sleep is still broken.
4. Which buildings and places are missing from the key?
Contours show decibel bands, not schools, hospitals, care homes, places of worship, allotments, footpaths or quiet gardens. Ask for overlays showing sensitive receptors inside each band. Ask how many schools and hospitals fall within the higher bands, not simply how many dwellings are affected.
Ask about outdoor amenity. A garden, a park or a playing field can be unusable at lower average levels than a living room. Ask whether the assessment includes local deprivation data and whether mitigations are available to people who cannot afford acoustic glazing or move house.
5. What assumptions about fleet, operations and mitigation are baked in?
Ask which assumptions about fleet replacement, track-keeping, continuous descent, resurfacing, noise barriers and operational penalties are doing the work in the model. Then ask whether those assumptions are enforceable, who audits them and what happens if airlines do not deliver.
Request a sensitivity analysis using an older or noisier fleet. If the contours depend on optimistic assumptions about technology and airline behaviour, residents should know how quickly the picture changes when those assumptions slip.
6. How will actual noise be monitored, and what happens if predictions fail?
A map is a prediction. Ask where the monitoring terminals will be, how often data will be published and what threshold triggers remedial action. Ask who sits on the community oversight body and whether it has independent technical advice and a budget.
Most importantly, ask what recourse residents have if the real noise is worse than the contour suggested. A commitment to review is not the same as a commitment to act. The answer should be written into any consent, not left to good will.
A minimum standard, not an obstacle
These questions do not require specialist expertise. They require a council officer or consultant to explain their work in public. Local groups can use them in consultation responses, freedom of information requests and motions to council. They can also form the basis of a resident-led audit of the 2026 maps.
Heathrow Pause believes that a pause is not a refusal to engage. It is a demand that the evidence be good enough to bear the weight placed on it. If the contours are sound, they will survive six straightforward questions. If they are not, residents deserve to know before the decision is made.